|
|
Sound visualizationThe interaction between sound and light can be used to visualize an arbitrary sound field, but in order to do so the acoustic field has to be scanned in a similar way as it is done in X-ray computerized tomography. This is illustrated in the picture below.
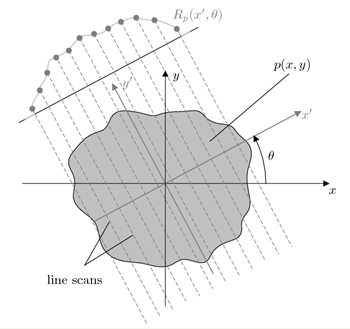
In this example, a set of parallel laser beams are sent through the acoustical space under investigation in a certain direction. This procedure must then be repeated for a certain number of angles of projection. The key idea here is that these projections can be interpreted mathematically as the Radon transform of the acoustic field. Thus, the original sound pressure distribution can be retrieved by solving the inverse problem, that is, by inverse Radon transforming the measured projections. You can find more information in my list of publications.
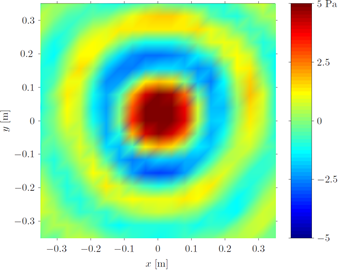
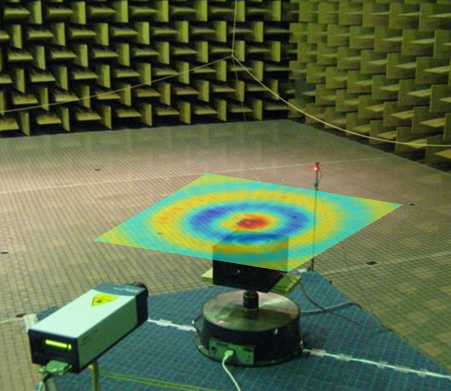
Measurement resultsAn experimental verification of the ideas mentioned above was carried out in an anechoic room, with a loudspeaker radiating a 2 kHz pure tone. The measuring plane was located 12 cm above the loudspeaker. The picture below shows the instantaneous sound pressure reconstructed using acousto-optic tomography.
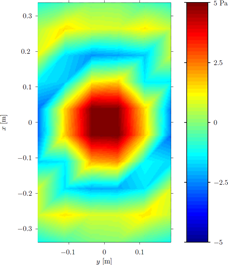
For ease of comparison, supplementary measurements were carried out under the same conditions (12 cm above the loudspeaker and the same excitation signal) with a planar rectangular array of 60 microphones. The figure below shows that the instantaneous sound pressure distribution reconstructed with the acousto-optic effect is in good agreement with the one measured with the microphone array at the same instant of time.
|